Understanding the Numbers, Scores, and Terminology in Your Child’s Neuropsychological Report

Parents who bring their child to a psychologist for an assessment need to know how to understand a neuropsychological report. It is important for parents to understand the meaning of the numbers and scores that are included in the results of their child’s standardized neuropsychological assessment. Remember that every score, percentile, and confidence interval (to be discussed below) are derived from the statistical manual that comes with every standardized test. Hence the term standardization, so we know that the scores of every child of every age are being held to the same statistical evaluation, and that their scores are NOT being subjectively interpreted.
Test scores are also evaluated as to their reliability: the consistency of what we are measuring. A measure is said to have a high reliability if it produces similar results under consistent conditions. Some measures are more reliable than others, because the tools we use to measure are better, and there is more consistency in what we are measuring. For example, measurements of height and weight are often extremely reliable. However, measuring blood pressure and processing speed might be less reliable.
Test scores are also evaluated as to their validity: the degree to which a measurement is meaningful and corresponds accurately to the real world. In other words, the measures need to fit what we are measuring. So, a valid measure of reading skills should assess real world reading ability, rather than the capability to retell a story that one has heard. For neuropsychological testing, this means that our interpretation of tests should correspond with what they are actually measuring.

For More Information on Numbers and Scores in your child’s report, Visit The Resources Provided Below:
Great explanation of scores and Interpretations: Written for school principals, but good for parents and produced by the National Association of School Psychologists.
Guide to comparing scores: Shows a chart that compares percentiles, standard scores, T scores.
Dumont and Willis description of Test scores: Widely cited psychologist tell you more than you wanted to know.
How scores relate to Learning Disabilities: Good summary of scores and learning issue.
Compares the meaning of different scores: Good graph to help in understanding scores.
Here are some other important guidelines to help you read through your child’s report:
What is Average?
Most psychological tests provide scores and/or percentiles to describe your child’s performance compared to a representative sample of same-aged peers, or the “norm group.” For example, an 8-year-old’s performance on a standardized test is compared to same-aged children, not a 12-year-old or 4-year-old. These scores are guidelines for what is average, above average, and below average compared to children of the same age. The norm group, and their within-average scores, represent the performance of the majority of children.
When we talk about “average scores” in a psychological report, this does not include only the mean, (the average of all scores) or the median (the score located at the 50th percentile of all scores). Average scores on a neuropsychological evaluation refers to a range of scores that is commonly achieved by the majority of people. This does not mean the 50th percentile, but may refer to the middle 68% of people taking the test (1 standard deviation). Average scores encompass most people. A useful and scientific visual representation of this is the Bell Curve: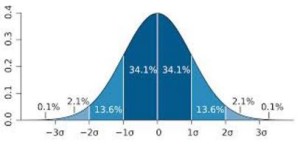
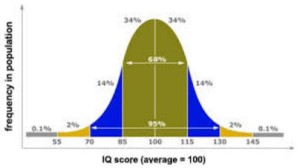 In the image on the left, we can see that the average scores are in the dark blue and take up 68% of the population. In the image on the right, we see IQ scores where a score of “100” is the midpoint of average, and scores from 85-115 constitute 68% of the population. Most IQ tests such as the WISC-V, WPPSI-IV, and the WAIS-IV classify scores of 90-109 as “Average,” 110-119 as “High Average,” 120-129 as “Superior” and scores above 130 as “Very Superior.” Scores of 80-89 are classified as “Low Average,” from 70-79as “Borderline” and scores below 70 as “Extremely Low”.
The term Standard Deviation is used to describe what variation from the average score is typical, or “standard” based on the norm group; this term will be discussed more below.
Percentiles
Percentiles ARE NOT equivalent to scores. They are calculated based on scores, but tell us that the child performed better than x% of the population. For example, a child that received an average score will be in the 50th percentile. This means that he or she scored better than 49% of the norm group, but was outscored by the other half of the norm group. Notice, falling in the 50th percentile is NOT equivalent to receiving a score of 50.
Scaled Scores
Most psychological tests base performance off of scaled scores and standard scores. Often, scaled scores are reported if the psychological test that was used was longer and had several sub-tests within it. A scaled score typically tells us how well a child did on a specific sub-test, and a standard score typically tells us how well a child did on a broad domain (which is often made of sub-tests).
Scaled Scores have a score range of 0 – 19 points, with an average score of 10 points. These scores are typically used for “Sub-tests,” which are smaller components of a larger psychological test, such as the WISC-V, the NEPSY-2, or the DKEFs.
Scaled scores have a standard deviation (a term briefly introduced above) of 3 points. What does this mean? Simply put, most children of the same age will score between a 7 and 13, and thus fall within the low average (7) to high average range (13). It is statistically typical for a child to perform within one standard deviation (3 points) of the average score, in either direction. An important cautionary statement is that “average” is a broad term and parents should take note of where their child falls within the average range. Most psychologists will agree that a child who scores a 7 (low average) has significantly different performance than a child who scores a 13 (high average). Whereas, three children who score a 9, 10, and 11 are likely more comparable in their “average” performances.
If a child were to score more than one standard deviation below, or above the mean: a greater difference of 3 points (either less than a 7, or more than a 13), such a deviation from the mean indicates uniquely high or uniquely low performance. A child who scores more than one standard deviation BELOW the mean (scoring a 5, for example) will have a very low percentile rank. This means that their score was better than only a small number of peers in the norm group; most of the norm group performed better than them. A child who scores more than one standard deviation ABOVE the mean (scoring a 16, for example) will have a very high percentile rank. This means that their score was better than most of their peers in the norm group; the child performed better than most of the norm group.
Standard Scores
Standard Scores follow the same principles as scaled scores, but often represent a bigger picture. For example, one standard score may summarize two or three scaled scores. Standard scores are often used in Intelligence Tests, Educational Tests, and in some measures of neuropsychological functioning, such as with the Wisconsin Card Sorting Test.
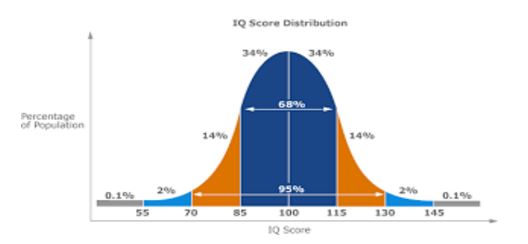
Standard scores have a larger range of below 69 to above 130, with an average score of 100 points. Standard scores have a set standard deviation of 15 points (one standard deviation = 15). We say “below 69” and “above 130,” because scores that lie higher or lower in the tail ends of the Bell Curve are rare and are usually similar in their descriptions. For example, there is little utility in comparing a standard score of 50 to 60, or a standard score of 140 to 150, because those scores represent uniquely impaired or gifted performances. With a standard deviation of 15, average standard scores range from 85 (low average) to 115 (high average). Scores that fall more than 15 points below or above the average score of 100 (more than one standard deviation below or above average) represent performances that are further below or above average.
T-Scores
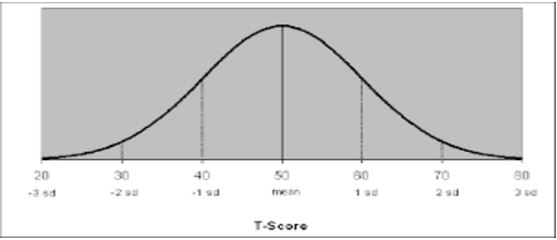
T Scores are another method of describing a person’s performance, where a T Score of 50 is precisely average and standard deviations are 10 points. Average scores are in the range of 40 to 60. T-Scores are often used in behavior rating scales such as the BASC-2, the BRIEF, and the Brown ADD Scales. For most clinical measures on these scales, a high score (above 60) is reflective of modest difficulties and a score above 70 suggests more significant concerns. However, these interpretations vary amongst tests as each test uses their own classifications and ranges. For some tests scores, from 60-69 are considered “at-risk” and slightly atypical from the norm, whereas another test, eg. the Brown ADD Scales views these scores as clinically significant.
Most low scores on clinical scales (below 40) are not interpreted any differently from scores between 40-50, and do not suggest a particular strength, but merely suggest the absence of a problem. A T-score of 65 on a measure of hyperactivity suggests concerns, but a score of 50 or 30 is interpreted as an absence of concerns.
However, some T-scores may measure strengths, such as the Adaptive Scales on the BASC-2. In this case, a high score (above 60) is interpreted as a sign of strength and a low score (below 40) typically means an absence of that skill.
Confidence Intervals
Finally, the research around standardized testing acknowledges that the scores obtained from a child’s performance may not be entirely perfect. To account for testing and human error, the scores described above are often offered alongside a Confidence Interval. A confidence interval expresses to what degree a score is “guaranteed” to be accurate. Since a test cannot claim 100% accuracy of any score, the confidence interval claims strong accuracy based on a range of scores.
For example, let’s say a child received a scaled score of 8, with a 95% confidence interval range of 7-9. This means that with high certainty, the child’s true score lies between 7 and 9, even if the received score of 8 is not 100% accurate. Here is another example: let’s say a child received a standard score of 110, with a 90% confidence interval range of 98-124. The score of 110 cannot be guaranteed, but it can be said with 90% certainty that the child’s score falls within the given range. So, if we could theoretically give this child the same test 100 times, and they did not learn anything from retaking the test, then 90% of the tests taken would produce a score between 98-124.
As a rule of thumb, 95% confidence intervals provide a more narrow range of scores (higher accuracy) than 90% confidence intervals (slightly wider range of scores to allow for more variation). Most psychological tests report at the 95% confidence interval and are quite reliable, often more so than medical tests. Next time you have your blood pressure taken at your physician’s office, ask them to check your left AND right arms; You are very likely to see some meaningful variation.
Receive online class information and helpful tips from Dr. Randy Kulman's LearningWorks for Kids |