What does an “Average” Test Score Mean?
What is Average?
Most psychological tests provide scores and/or percentiles to describe your child’s performance compared to a representative sample of same-aged peers, or the “norm group.” For example, an 8-year-old’s performance on a standardized test is compared to same-aged children, not a 12-year-old or 4-year-old. These scores are guidelines for what is average, above average, and below average compared to children of the same age. The norm group, and their within-average scores, represent the performance of the majority of children.
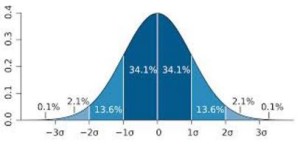
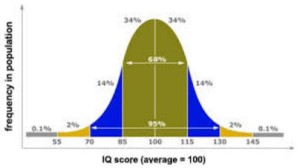
When we talk about “average scores” in a psychological report, this does not include only the mean, (the average of all scores) or the median (the score located at the 50th percentile of all scores). Average scores on a neuropsychological evaluation refers to a range of scores that is commonly achieved by the majority of people. This does not mean the 50th percentile, but may refer to the middle 68% of people taking the test (1 standard deviation). Average scores encompass most people. A useful and scientific visual representation of this is the Bell Curve:
In the image on the left, we can see that the average scores are in the dark blue and take up 68% of the population. In the image on the right, we see IQ scores where a score of “100” is the midpoint of average, and scores from 85-115 constitute 68% of the population. Most IQ tests such as the WISC-V, WPPSI-IV, and the WAIS-IV classify scores of 90-109 as “Average,” 110-119 as “High Average,” 120-129 as “Superior” and scores above 130 as “Very Superior.” Scores of 80-89 are classified as “Low Average,” from 70-79as “Borderline” and scores below 70 as “Extremely Low”.
The term Standard Deviation is used to describe what variation from the average score is typical, or “standard” based on the norm group; this term will be discussed more below.
Visit the South County Child & Family Consultants website for more great articles!

