Standard Scores
Standard Scores follow the same principles as scaled scores, but often represent a bigger picture. For example, one standard score may summarize two or three scaled scores. They are often used in Intelligence Tests, Educational Tests, and in some measures of neuropsychological functioning, such as with the Wisconsin Card Sorting Test.
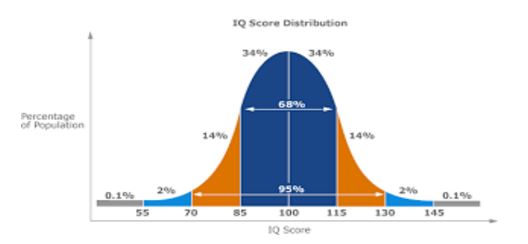
Standard scores have a larger range of below 69 to above 130, with an average score of 100 points. Standard scores have a set standard deviation of 15 points (one standard deviation = 15). We say “below 69” and “above 130,” because scores that lie higher or lower in the tail ends of the Bell Curve are rare and are usually similar in their descriptions. For example, there is little utility in comparing a standard score of 50 to 60, or a standard score of 140 to 150, because those scores represent uniquely impaired or gifted performances. With a standard deviation of 15, average standard scores range from 85 (low average) to 115 (high average). Scores that fall more than 15 points below or above the average score of 100 (more than one standard deviation below or above average) represent performances that are further below or above average.

Visit the South County Child & Family Consultants website for more great articles!
Receive online class information and helpful tips from Dr. Randy Kulman's LearningWorks for Kids |